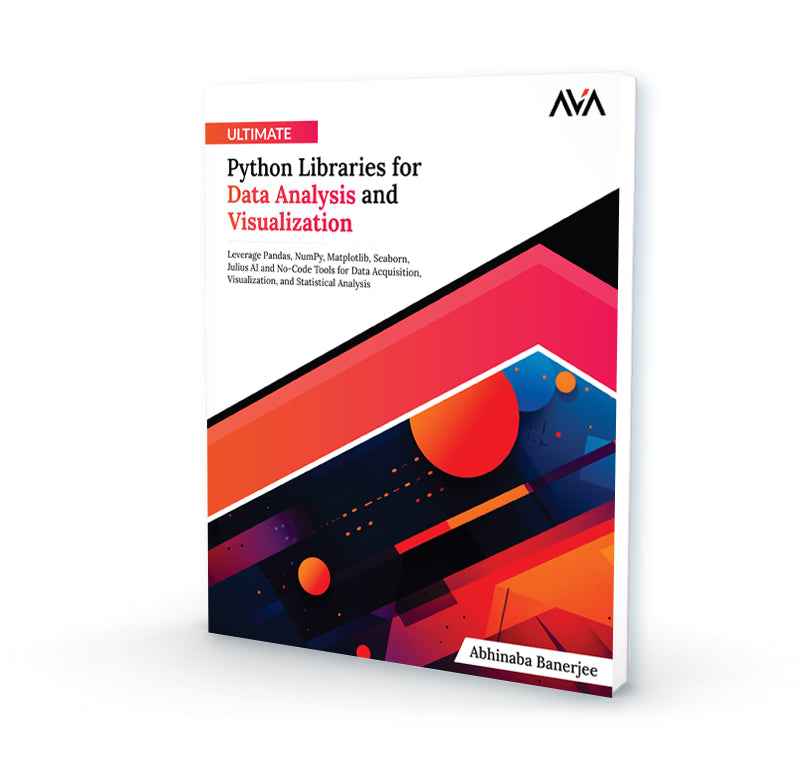
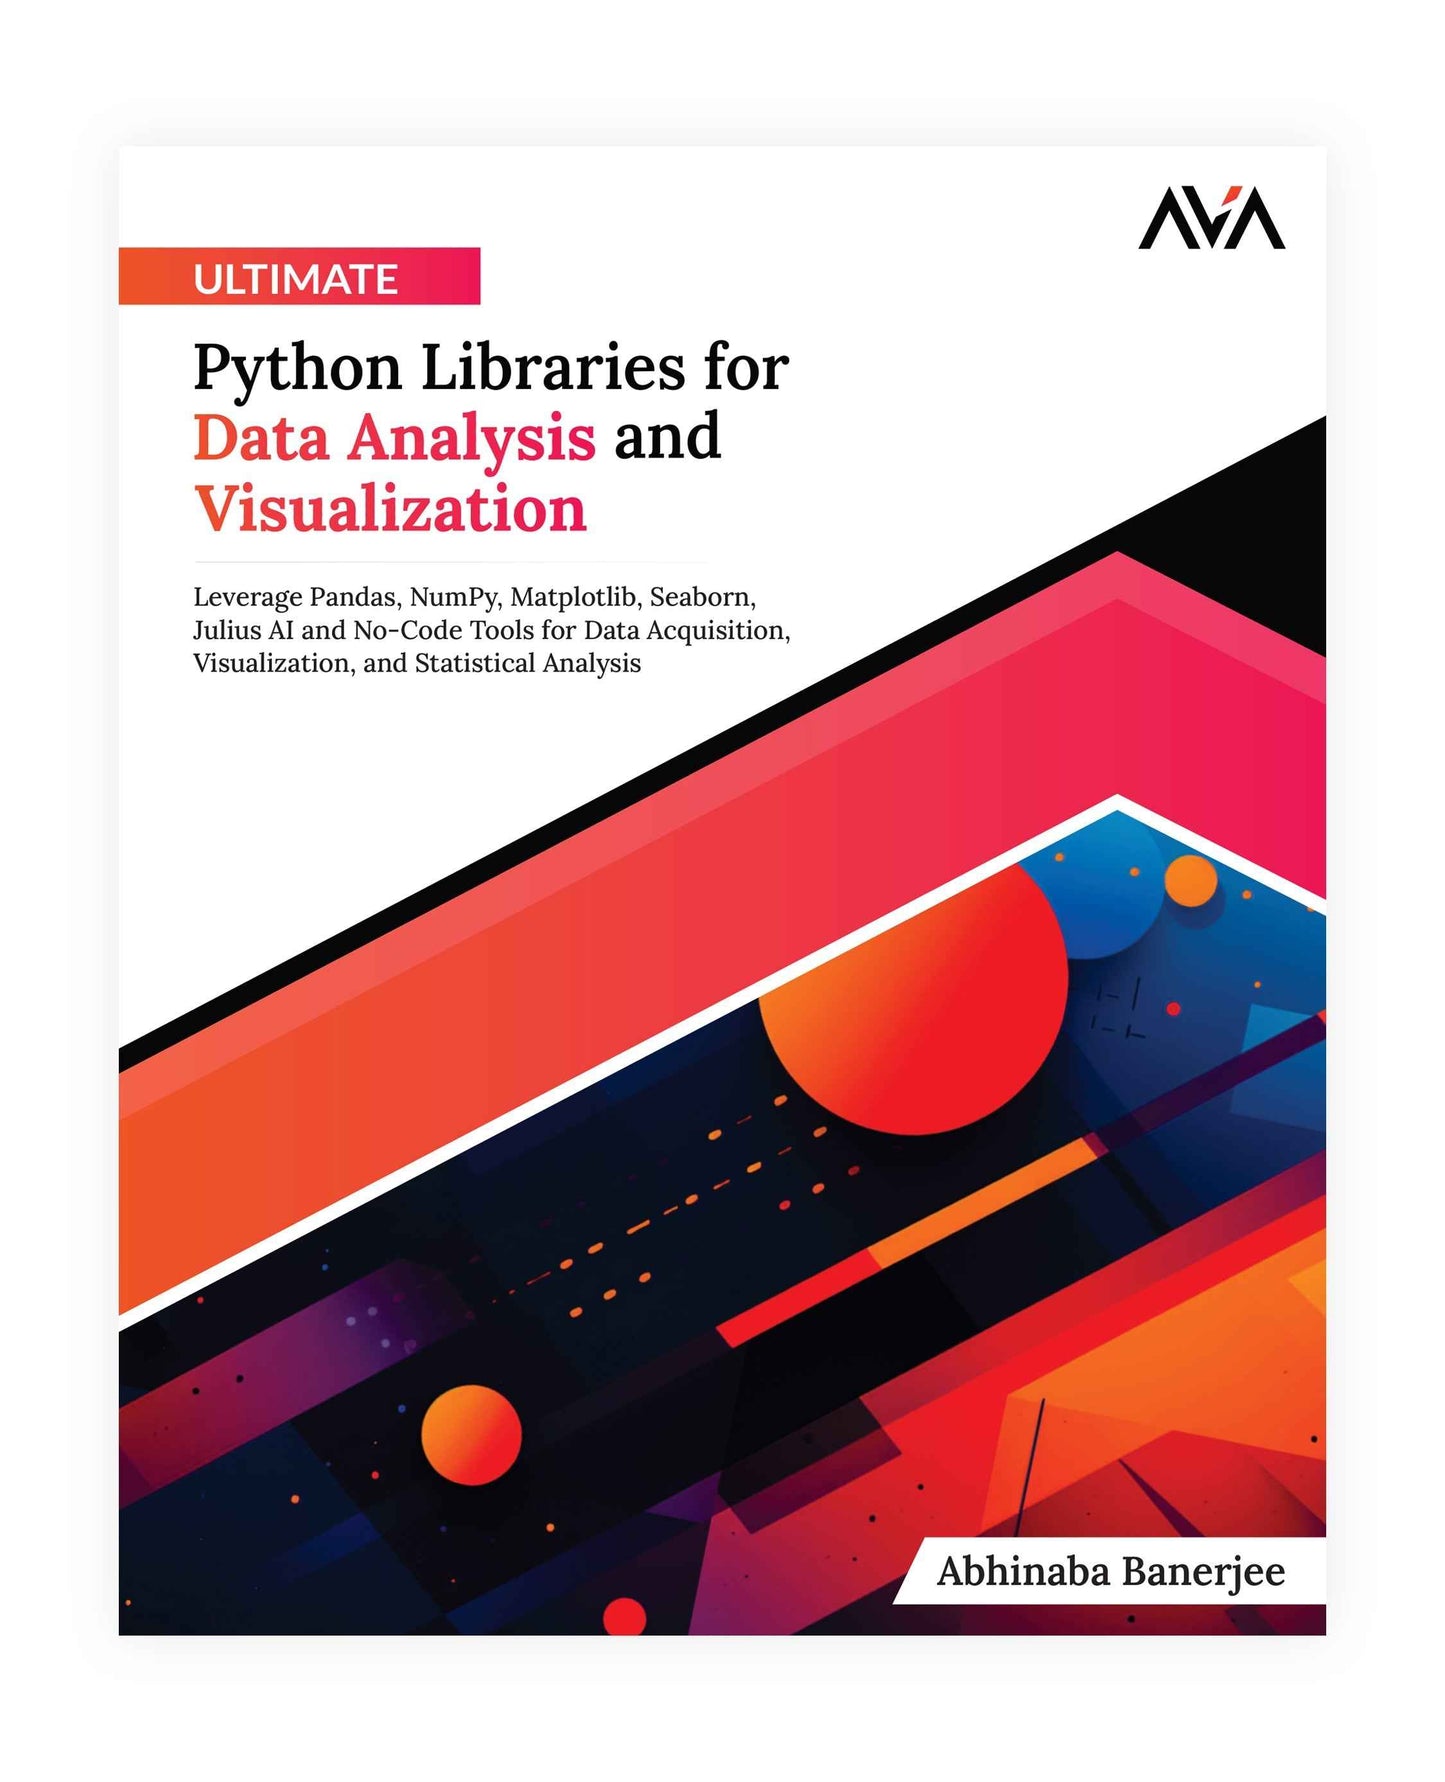
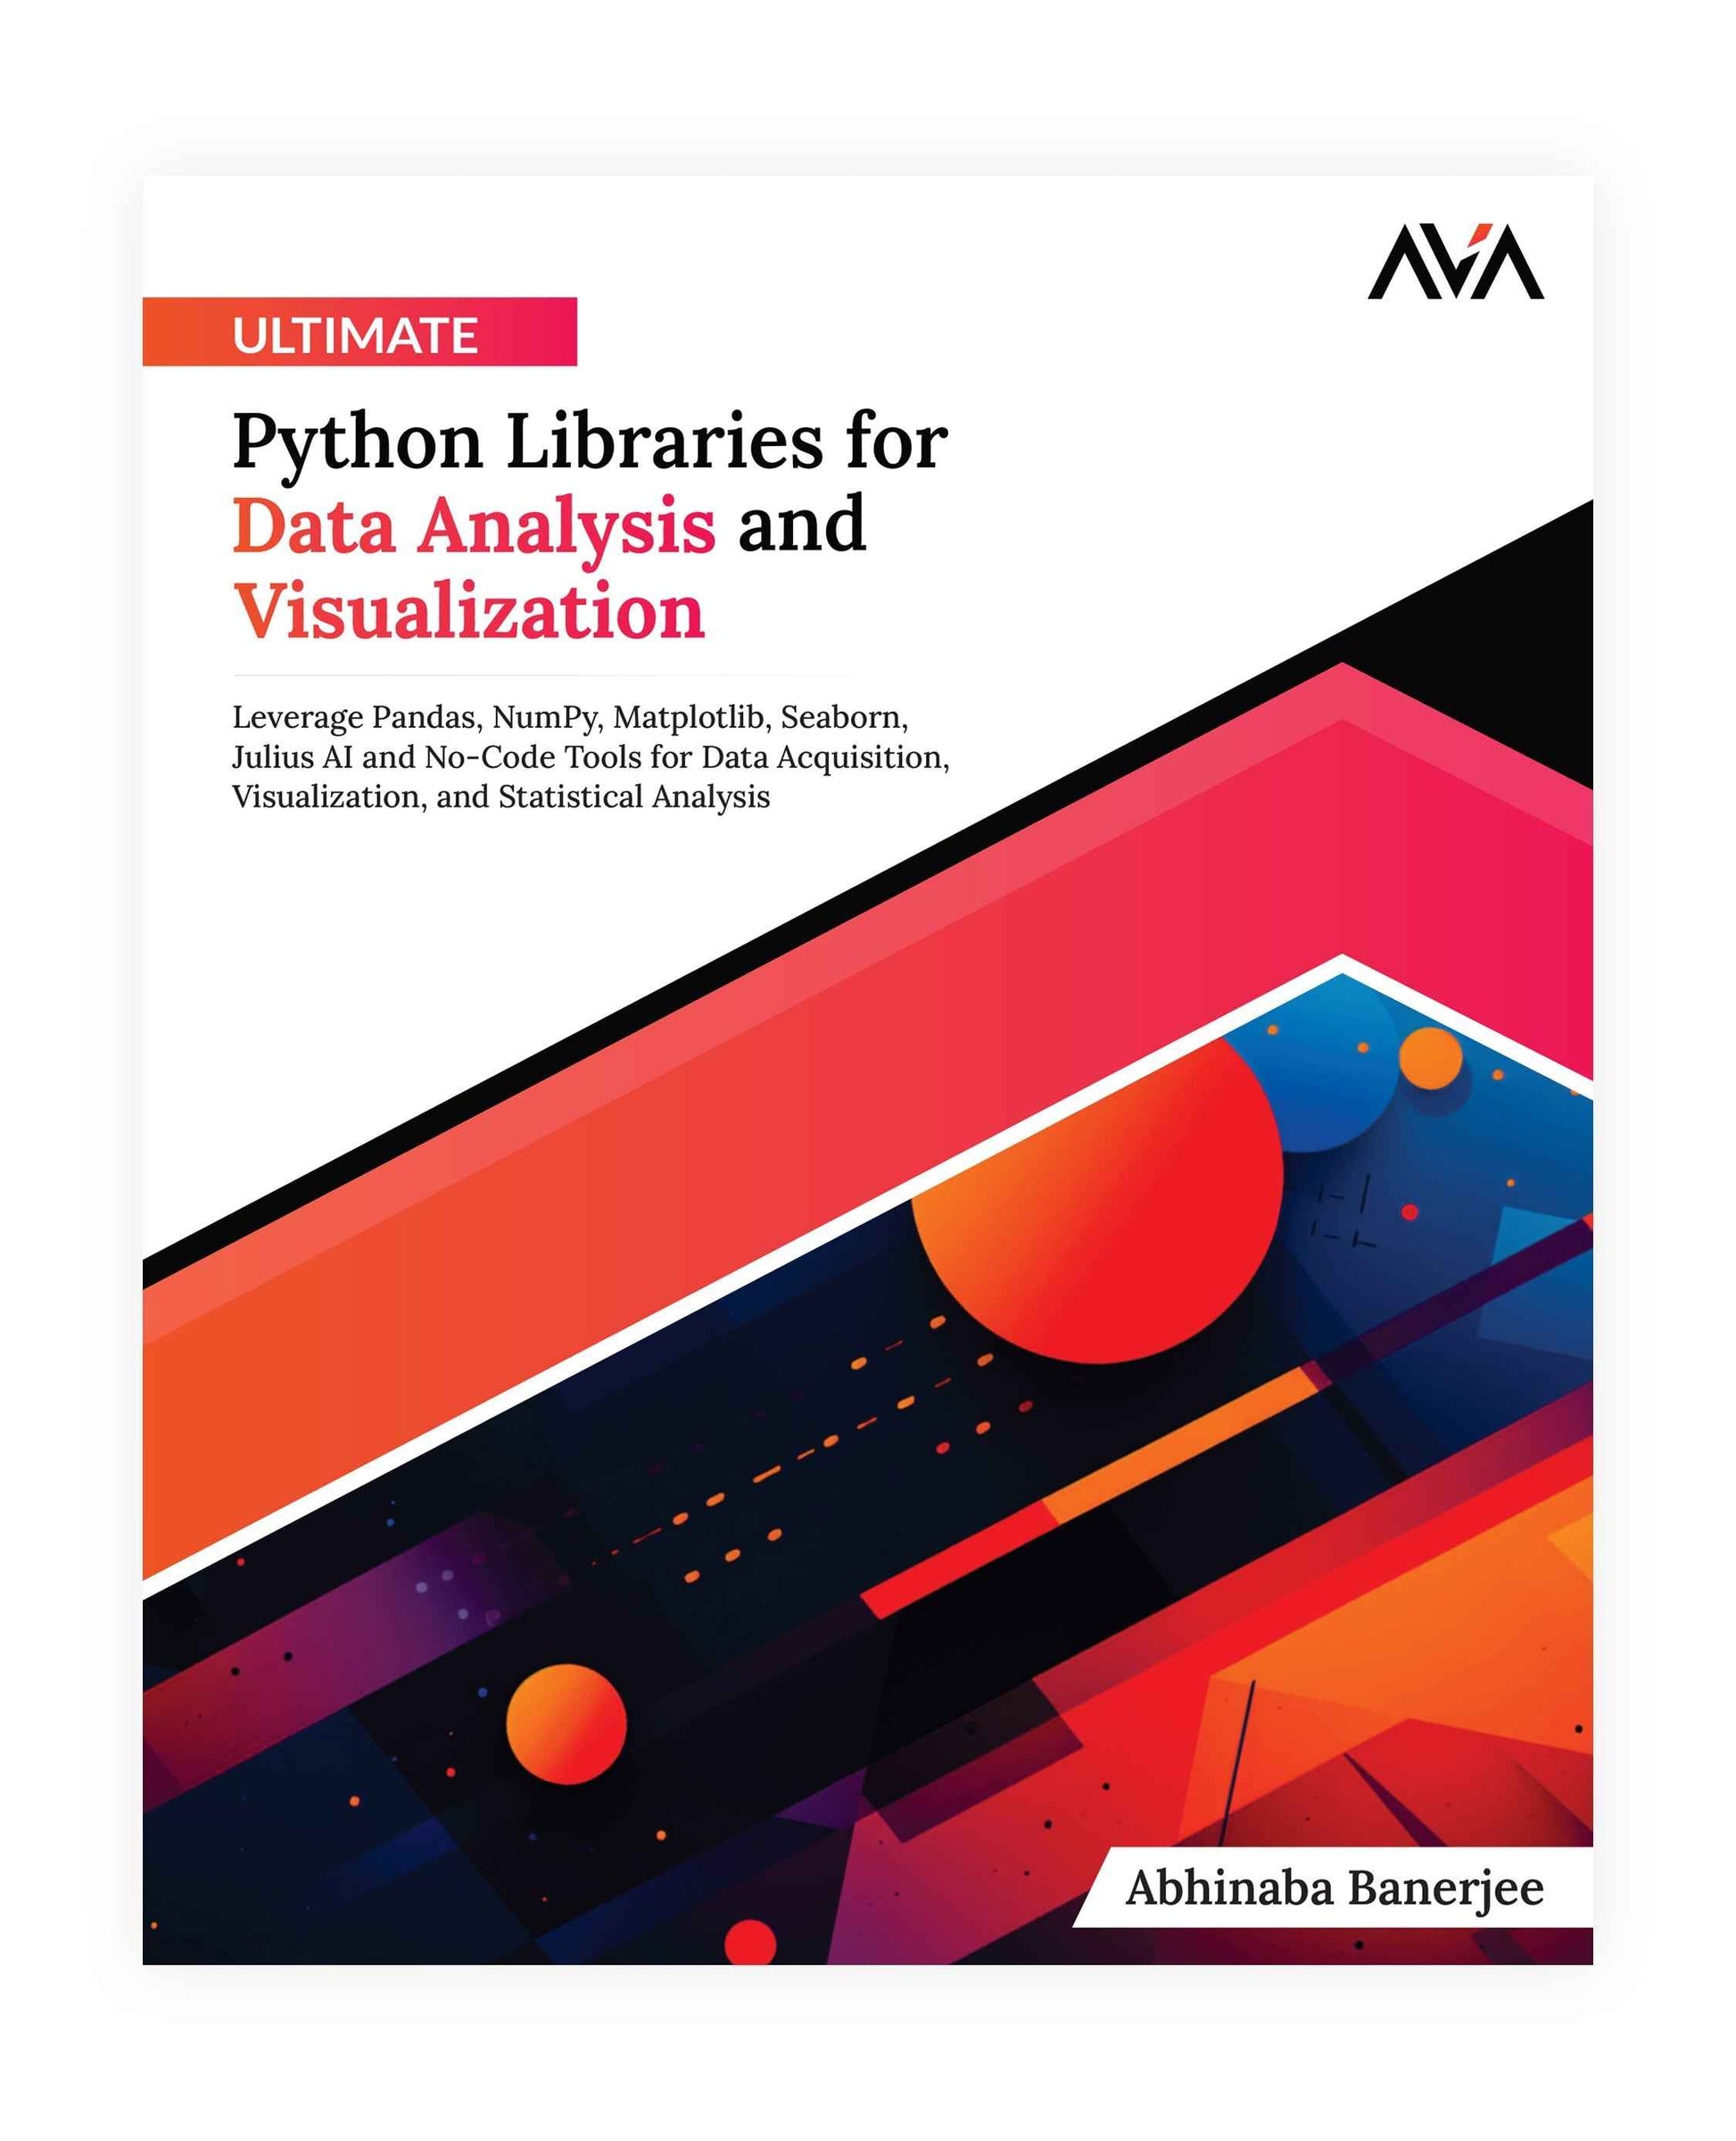
Ultimate Python Libraries for Data Analysis and Visualization
Ultimate Python Libraries for Data Analysis and Visualization
SKU:9788197081910
Couldn't load pickup availability
ISBN: 9788197081910
eISBN: 9788197081989
Rights: Worldwide
Author Name: Abhinaba Banerjee
Publishing Date: 04-April-2024
Dimension: 7.5*9.25 Inches
Binding: Paperback
Page Count: 266
Share


Collapsible content
Description
Test your Data Analysis skills to its fullest using Python and other no-code tools
Key Features
● Comprehensive coverage of Python libraries such as Pandas, NumPy, Matplotlib, Seaborn, Julius AI for data acquisition, preparation, analysis, and visualization
● Real-world projects and practical applications for hands-on learning
● In-depth exploration of low-code and no-code tools for enhanced productivity
Book Description
Ultimate Data Analysis and Visualization with Python is your comprehensive guide to mastering the intricacies of data analysis and visualization using Python. This book serves as your roadmap to unlocking the full potential of Python for extracting insights from data using Pandas, NumPy, Matplotlib, Seaborn, and Julius AI. Starting with the fundamentals of data acquisition, you'll learn essential techniques for gathering and preparing data for analysis. From there, you’ll dive into exploratory data analysis, uncovering patterns and relationships hidden within your datasets.
Through step-by-step tutorials, you'll gain proficiency in statistical analysis, time series forecasting, and signal processing, equipping you with the tools to extract actionable insights from any dataset. What sets this book apart is its emphasis on real-world applications. With a series of hands-on projects, you’ll apply your newfound skills to analyze diverse datasets spanning industries such as finance, healthcare, e-commerce, and more.
By the end of the book, you'll have the confidence and expertise to tackle any data analysis challenge with Python. To aid your journey, the book includes a handy Python cheat sheet in the appendix, serving as a quick reference guide for common functions and syntax.
What you will learn
● Acquire data from various sources using Python, including web scraping, APIs, and databases.
● Clean and prepare datasets for analysis, handling missing values, outliers, and inconsistencies.
● Conduct exploratory data analysis to uncover patterns, trends, and relationships within your data.
● Perform statistical analysis using Python libraries such as NumPy and Pandas, including hypothesis testing and regression analysis.
● Master time series analysis techniques for forecasting future trends and making data-driven decisions.
● Apply signal processing methods to analyze and interpret signals in data, such as audio, image, and sensor data.
● Engage in real-world projects across diverse industries, from finance to healthcare, to reinforce your skills and experience.
Who is This Book For?
This book is ideal for beginners, professionals, or students aiming to enhance their careers through hands-on experience in data acquisition, preparation, analysis, time series, and signal processing. Prerequisite knowledge includes basic Python and introductory statistics. Whether starting fresh or seeking to refresh skills, this comprehensive guide helps readers upskill effectively.
Table of Contents
1. Introduction to Data Analysis and Data Visualization using Python
2. Data Acquisition
3. Data Cleaning and Preparation
4. Exploratory Data Analysis
5. Statistical Analysis
6. Time Series Analysis and Forecasting
7. Signal Processing
8. Analyzing Real-World Data Sets using Python
APPENDIX A Python Cheat Sheet
Index
About Author & Technical Reviewer
Abhinaba Banerjee has a background in Electronics and Communication Engineering, holding both Bachelor's and Master’s degrees. He also has an MSc in Big Data Analytics for Business from France. Currently, he works as a Data Analyst, primarily focusing on data analysis, preparing dashboards, and cleaning and preparing data from messy datasets. Additionally, he writes blogs on various sites such as Medium, Hashnode, and Showcase.
Abhinaba Banerjee’s expertise ranges from Data Analytics using tools like Python, SQL, Excel, and PowerBI to Data Science, where he uses libraries like scikit-learn and Huggingface for NLP, GitHub for showcasing his projects, and is currently involved in building end-to-end MLOps projects.
ABOUT TECHNICAL REVIEW
Sarika is a versatile Data Scientist with over II years of experience across various domains. With a PG Diploma in Machine Learning and A1 from 111T Bangalore and a Master's in ML and A1 from Liverpool University, she has a solid foundation in statistical analysis, machine learning, and data visualization. Currently working with a leading tech company, Sarika swiftly ascended through the ranks due to her exceptional analytical skills and attention to detail. She has dedicated her career to ensuring the accuracy, reliability, and efficiency of data-driven solutions, from developing predictive models to optimizing decision-making processes. In addition to her technical skills, Sarika is an effective communicator and collaborator, bridging the gap between technical and non-technical stakeholders.
Outside of work, Sarika is passionate about staying abreast of the latest developments in data science and technology. She shares her expertise through blogs on a variety of topics, including machine learning algorithms and data visualization. Sarika has participated in several hackathons, using her expertise in data science, machine learning, and artificial intelligence to develop creative solutions and prototypes.


